Mesh, surface & contour plots of optimisation results
This function plots surfaces produced by interpolation between the points at which the objective function was evaluated. The optimisation terrain may be represented as a mesh, surface or contour plot. The points which do not meet the optimisation constraints will be cropped from the surface.
Syntax
optimisationTerrain(STRUCTOUT,STRUCTIN)
optimisationTerrain(STRUCTOUT,STRUCTIN,PLOTTYPE)
optimisationTerrain(STRUCTOUT,STRUCTIN,PLOTTYPE,FIG)
optimisationTerrain(STRUCTOUT,STRUCTIN,PLOTTYPE,FIG,VIEW)
optimisationTerrain(STRUCTOUT,STRUCTIN,PLOTTYPE,FIG,VIEW,DIMS)
FIG = optimisationTerrain(...)
Description
optimisationTerrain(STRUCTOUT,STRUCTIN) where STRUCTOUT is the results structure returned by OptionsMatlab and STRUCTIN is the OptionsMatlab input structure.
optimisationTerrain(STRUCTOUT,STRUCTIN,PLOTTYPE) as above where PLOTTYPE is a scalar which indicates the type of plot. The valid values of PLOTTYPE are:
1 = Mesh of valid points [default]
2 = Mesh of valid points in a single colour
3 = Surface of valid points
4 = 3D contour plot of valid points
5 = 3D contour plot of valid points with a mesh
6 = Mesh of all points
7 = Mesh of all points in a single colour
8 = Surface of all points
9 = 3d contour plot of all points
10 = 3d contour plot of all points with a mesh
optimisationTerrain(STRUCTOUT,STRUCTIN,PLOTTYPE,FIG) as above where FIG is the figure in which to plot the optimisation terrain. If FIG is not provide a new figure will be generated. FIG can also be empty [].
optimisationTerrain(STRUCTOUT,STRUCTIN,PLOTTYPE,FIG,VIEW) as above where VIEW is a two element vector that sets the view of the 3D plot. For example VIEW = [0 90] for overhead plots. The default view is [-37.5, 30]. VIEW can also be empty [].
optimisationTerrain(STRUCTOUT,STRUCTIN,PLOTTYPE,FIG,VIEW,DIMS) as above where DIMS is a two element vector specifying the two design variables to be plotted. By default the first two design variables are plotted.
FIG = optimisationTerrain(...) as above where FIG is a the number of figure in which the terrain was plotted.
Example
input = createBeamStruct;
results = OptionsMatlab(input)
optimisationTerrain(results, input)
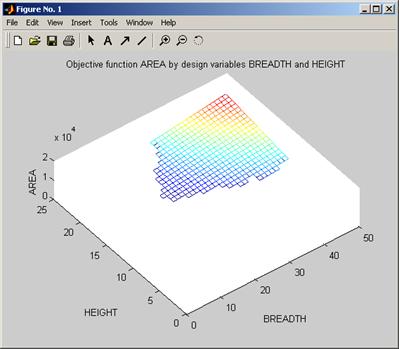
Figure 11 Plot produced by optimisationTerrain
See also
view, mesh, griddata
Copyright © 2007, The Geodise Project, University of Southampton